Data Visualizations
Use our powerful visualizations to analyze & interact with your data, understand connections & trends, process information far more accurately & quickly. Contact us for development of the customized data visualization solutions.
Recent Work:
Client's Sales: Franchises sales data world wide.
View
View
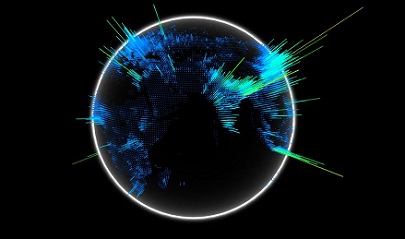
World population: mapped over 3d world.
View
View
Covid-19 Cases: Bar Chart Race / Timeline animation
View
View
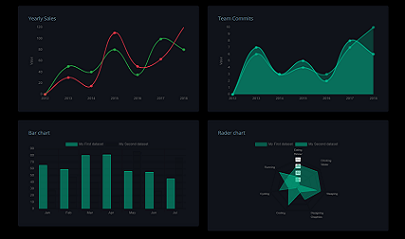
Standard Charts
View
View
Custom Charts & Dashboards
Dashboard
Total Cases
1,905,935
Total Recovered
446,336